ESG Data
The Asahi Kasei Group publishes cost and performance data concerning its environmental activities.
Investment for Environmental Protection and Safety
The Asahi Kasei Group has invested the necessary management resources in ESH & QA activities.
Investments in environmental protection and safety-related facilities up to fiscal 2024 are shown below.
Investment for Environmental Protection and Safety
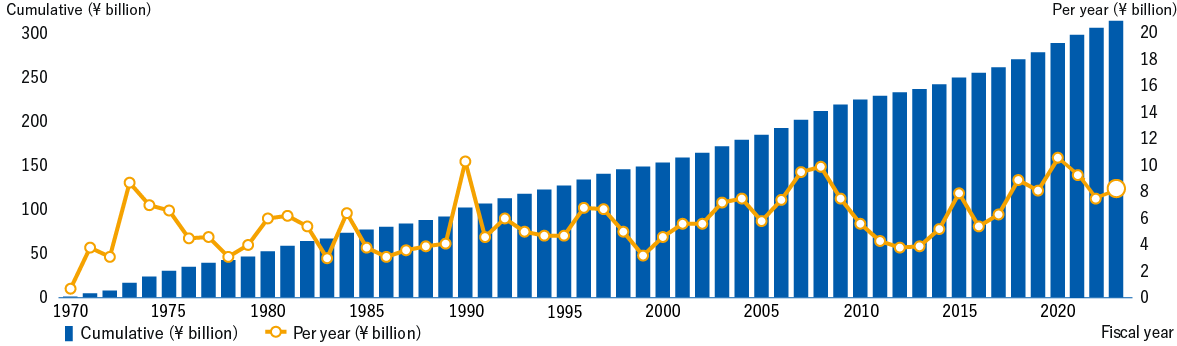
Investment for Environmental Protection and Safety
(¥ billion)
| FY2020 | FY2021 | FY2022 | FY2023 | FY2024 | |
|---|---|---|---|---|---|
| Environmental protection | 38.8 | 28.0 | 26.5 | 25.5 | 14.6 |
| Safety | 66.3 | 64.3 | 48.5 | 56.2 | 72.7 |
| Total | 105.2 | 92.3 | 75.0 | 81.7 | 87.3 |
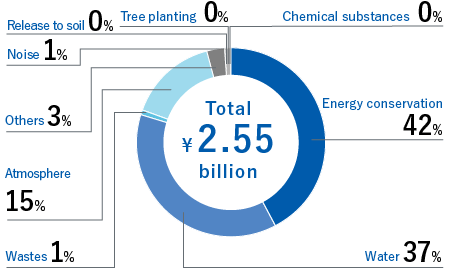
Investments in environmental protection-related facilities (fiscal 2024)
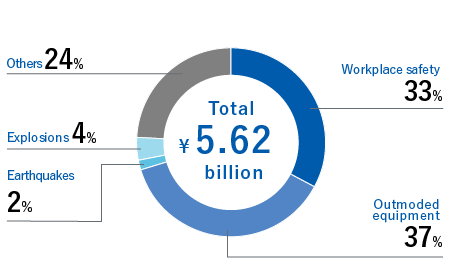
Investments in safety-related facilities (fiscal 2024)
Environmental Accounting
We classify the cost of our measures for environmental protection in accordance with cost classification standards promulgated by the Ministry of the Environment.
Environmental accounting
(¥ million)
| Cost classification | FY2020 | FY2021 | FY2022 | FY2023 | FY2024 | ||||||
| Investment | Expense | Investment | Expense | Investment | Expense | Investment | Expense | Investment | Expense | ||
| 1 | Combined operation area | 3,628 | 7,666 | 2,755 | 9,914 | 2,098 | 10,080 | 1,928 | 10,610 | 1,708 | 9,264 |
|---|---|---|---|---|---|---|---|---|---|---|---|
| Pollution prevention | 2,241 | 5,186 | 1,399 | 6,923 | 1,017 | 6,785 | 1,307 | 7,177 | 1,125 | 5,809 | |
| Global environmental protection | 1,246 | 689 | 1,069 | 955 | 945 | 963 | 442 | 1,027 | 472 | 1,080 | |
| Resource circulation | 142 | 1,792 | 287 | 2,036 | 136 | 2,332 | 180 | 2,407 | 111 | 2,375 | |
| 2 | Upstream and downstream | 0 | 102 | 0 | 104 | 0 | 167 | 0 | 102 | 0 | 7 |
| 3 | Management activities | 25 | 654 | 19 | 1,294 | 136 | 1,953 | 38 | 1,409 | 41 | 689 |
| 4 | R&D | 228 | 2,185 | 198 | 1,793 | 374 | 2,628 | 674 | 2,837 | 103 | 4,812 |
| 5 | Community outreach | 0 | 18 | 0 | 17 | 0 | 25 | 0 | 21 | 0 | 48 |
| 6 | Environmental damage | 3 | 196 | 4 | 199 | 0 | 542 | 0 | 217 | 0 | 245 |
| Total | 3,885 | 10,822 | 2,976 | 13,321 | 2,608 | 15,395 | 2,641 | 15,197 | 1,852 | 15,064 | |
Environmental Management
Number and percentage of sites with environmental management system certification (fiscal 2024)
| Certification | Number of certified sites | Percentage of certified sites (%) | |
| Japan | Overseas | ||
| ISO14001 | 22 | 37 | 79 |
|---|---|---|---|
Climate change
Trends in greenhouse gas emissions by scope
(million tons CO2 equivalent)
| Scope / Category | FY2020 | FY2021 | FY2022 | FY2023 | FY2024 | ||
| Scope 1 | 3.01 | 3.10 | 2.83 | 2.38 | 2.50 | ||
|---|---|---|---|---|---|---|---|
| Scope 2 | 0.90 | 0.94 | 0.83 | 0.79 | 0.70 | ||
| Total (Scope 1 and 2) | 3.91 | 4.03 | 3.67 | 3.17 | 3.20 | ||
| Scope 3 | 1 | Purchased goods and services | 4.62 | 4.72 | 4.78 | 4.10 | 4.51 |
| 2 | Capital goods | 0.39 | 0.45 | 0.44 | 0.47 | 0.56 | |
| 3 | Fuel and energy-related activities (not included in Scope 1 or Scope 2) | 0.78 | 0.77 | 0.86 | 0.69 | 0.90 | |
| 4 | Upstream transportation and distribution | 0.25 | 0.24 | 0.24 | 0.20 | 0.21 | |
| 5 | Waste generated in operations | 0.00 | 0.07 | 0.07 | 0.07 | 0.07 | |
| 6 | Business travel | 0.00 | 0.00 | 0.02 | 0.02 | 0.03 | |
| 7 | Employee commuting | 0.03 | 0.03 | 0.03 | 0.03 | 0.03 | |
| 8 | Upstream leased assets | - | - | - | - | - | |
| 9 | Downstream transportation and distribution | - | - | - | - | - | |
| 10 | Processing of sold products | - | - | - | - | - | |
| 11 | Use of sold products | 1.34 | 1.92 | 1.60 | 1.39 | 1.37 | |
| 12 | End-of-life treatment of sold products | 5.87 | 5.95 | 5.98 | 4.92 | 1.53 | |
| 13 | Downstream leased assets | - | - | - | - | - | |
| 14 | Franchise | - | - | - | - | - | |
| 15 | Investment | - | - | - | - | - | |
| Total (Scope 3) | 13.28 | 14.15 | 14.00 | 11.89 | 9.19 | ||
- Notes:
- ・Calculation method for Scope 3:
Our Scope 3 GHG emissions are calculated using the Corporate Value Chain (Scope 3) Accounting and Reporting Standard and its technical guidance issued by the Greenhouse Gas Protocol. For the greenhouse gas emission factors, we used data available in the Carbon Footprint Communication Program database prepared by the Japan Environmental Management Association for Industry and the Embodied Energy and Emission Intensity Data for Japan Using Input-Output Tables (3EID): Inventory Data for LCA prepared by the National Institute for Environmental Studies, Japan until fiscal 2019.
Since fiscal 2020, we have referred to the Embodied Energy and Emission Intensity Data for Japan Using Input-Output Tables (3EID) (2015): Inventory Data for LCA prepared by the National Institute for Environmental Studies, Japan, IDEA v2.3 by the National Institute of Advanced Industrial Science and Technology, and the Emissions Unit Value Database Ver3.5 for Accounting of Greenhouse Gas Emissions, etc., by Organizations Throughout the Supply Chain issued by the Ministry of the Environment, etc. - ・Calculation method for purchased products and services:
Items with emissions equal to or greater than 4,000 tons of equivalent were included. The emissions were calculated by multiplying the amounts, either in physical or monetary units, of products and services purchased from outside the Asahi Kasei Group by Asahi Kasei Corp. and its major overseas consolidated subsidiaries, Asahi Kasei Homes, Asahi Kasei Construction Materials, Asahi Kasei Microdevices, and Asahi Kasei Medical by the respective emission factor for each type of raw material or service. - ・Calculation method for waste generated from business operations:
From fiscal 2021, the activity volume was changed from final disposal volume to effluent volume. - ・Calculation method for use of sold products:
Until fiscal 2020, the calculation was based on the calculation standards set by Asahi Kasei Homes and using the emissions intensity from Housing Tech. R&D Labs’ report. The period covered by the calculation was calculated based on the number of Hebel houses (detached houses and apartment buildings) delivered in each fiscal year (before fiscal 2020, based on the number of houses delivered; in fiscal 2020, based on the total floor area of Hebel houses delivered). The calculation period was set to 60 years of useful life, and the CO2 emissions reduction effect based on the actual installation of energy-saving equipment, which differs in each case, was deducted from the calculation.
From fiscal 2021, the following calculations were made using the Building Research Institute's "Energy Consumption Performance Calculation Program (Residential Version)" for house for which a certificate of confirmation was issued during the fiscal year.
∑ (annual energy use by energy type per household × emission factor by energy type) × useful life (60 years)
Emission factor by energy type (FY2024)
- Emission factor
- Electricity 0.423 (t-CO2/thousand kWh) and 8.64 (GJ/thousand kWh), city gas 0.051 (t-CO2/GJ), kerosene 0.069 (t-CO2/GJ)
- ・Calculation method for end-of-life treatment of sold products:
For Asahi Kasei Corp. and its major overseas consolidated subsidiaries, Asahi Kasei Construction Materials, Asahi Kasei Microdevices, and Asahi Kasei Medical, emissions are calculated by multiplying the weight of products purchased each fiscal year by the CO2 emission factor at the time of disposal for each product.
For Asahi Kasei Homes, emissions are calculated by multiplying the number of Hebel Haus units delivered each fiscal year by the CO2 emission factor per building.
In fiscal year 2024, raw materials purchased that can be clearly identified as not ultimately becoming waste after being incorporated into products were excluded from the calculation. Emissions were estimated by applying waste-type-specific emission factors for domestic operations. For overseas operations, based on the WBCSD Chemicals' Guidance for Accounting & Reporting Corporate GHG Emissions in the Chemical Sector Value Chain, emissions were estimated by applying emission factors by waste type and treatment method, assuming that 20% of waste is treated by incineration and 80% by landfill.
Under the conventional calculation methodology, Category 12 emissions for fiscal year 2024 are estimated at 5.53 million tons CO2-eq.
Trends in greenhouse gas emissions in Japan
million tons CO2 equivalent
| Item | Index set at Kyoto Protocol (1990) |
Baseline year (2005) |
FY2020 | FY2021 | FY2022 | FY2023 | FY2024 |
|---|---|---|---|---|---|---|---|
| Carbon dioxide (CO2) | 5.06 | 4.96 | 2.51 | 2.75 | 2.51 | 2.12 | 2.17 |
| Methane (CH4) | 0.00 | 0.01 | 0.00 | 0.00 | 0.00 | 0.00 | 0.00 |
| Nitrous oxide (N2O) | 6.82 | 0.76 | 0.29 | 0.09 | 0.08 | 0.06 | 0.05 |
| Hydrofluorocarbons (HFCs) | 0.16 | 0.02 | 0.03 | 0.03 | 0.03 | 0.03 | 0.03 |
| Perfluorocarbons (PFCs) | 0.01 | 0.14 | 0.06 | 0.01 | 0.01 | 0.00 | 0.00 |
| Sulfur hexafluoride (SF6) | 0.00 | 0.04 | 0.01 | 0.00 | 0.00 | 0.00 | 0.01 |
| Nitrogen trifluoride (NF3) | - | - | 0.00 | 0.00 | 0.00 | 0.00 | 0.00 |
| Total | 12.06 | 5.92 | 2.91 | 2.87 | 2.62 | 2.22 | 2.26 |
- Notes:
- ・Calculation standards for greenhouse gas emissions:
For greenhouse gases covered by the Act on Rationalization of Energy Use and Shift to Non-fossil Energy and the Act on Promotion of Global Warming Countermeasures, calculations are in accordance with the methods stipulated by these laws. For gases not covered by either law, calculation methods are based on considerations such as chemical reactions. - ・CO2 emissions from generation of electricity and steam sold to other companies are excluded from data for the baseline year but included in annual data.
- ・For purchased electricity, ‘basic’ CO2 emission factors were used through FY2019, and ‘adjusted’ CO2 emission factors were used from FY2020 to FY2023. From FY2024 onward, a revised ‘basic’ CO2 emission factors (adjusted for non-fossil power sources) have been applied.This change has had a minor impact on total CO2 emissions.
Overseas greenhouse gas emissions
million tons CO2 equivalent
| FY2020 | FY2021 | FY2022 | FY2023 | FY2024 | |
| Greenhouse gas emissions | 1.00 | 1.16 | 1.05 | 0.95 | 0.94 |
|---|
- Note:・Calculation standards for greenhouse gas emissions:
Overseas greenhouse gas emissions are calculated, in principle, based on the provisions given by the Act on the Rational Use of Energy and the Act on Promotion of Global Warming Countermeasures, and CO2 emissions from the burning of by-product gases are mainly calculated by material balance. Until fiscal 2020, CO2 emissions associated with purchased electricity were calculated using the latest country-specific emission factors shown in the International Energy Agency's (IEA) Emissions Factors. However, from fiscal 2021, in order to aggregate GHG emissions with values closer to actual situations, we have calculated emissions with the available emission factors in the following order of priority: 1) emission factors of procurement sources, 2) values set by national governments, and 3) IEA country-specific emission factors.
FY2024 global greenhouse gas emissions by segment
million tons CO2 equivalent
| Item | Material | Homes | Health Care | Other | Total |
| Greenhouse gas emissions | 2.99 | 0.10 | 0.11 | 0.00 | 3.20 |
|---|
CO2 emissions from product shipment (FY2024)
| Material | Homes | Health Care | Other | Total | |
| Shipment volume (million ton-km) |
662.25 | 310.33 | 4.12 | 0.00 | 976.70 |
|---|---|---|---|---|---|
| CO2 emissions (tons of CO2 equivalent) | 38,561 | 34,471 | 745 | 0 | 73,777 |
Proportion of low-pollution vehicles*
(Number of vehicles)
| FY2020 | FY2021 | FY2022 | FY2023 | FY2024 | ||
| Used on public roads | Low-pollution vehicles | 1,415 | 1,506 | 1,561 | 1,869 | 1,758 |
|---|---|---|---|---|---|---|
| Other | 40 | 44 | 62 | 55 | 48 | |
| Subtotal | 1,455 | 1,550 | 1,623 | 1,924 | 1,806 | |
| Used within plant grounds | Low-pollution vehicles | 726 | 764 | 527 | 611 | 454 |
| Other | 66 | 73 | 149 | 137 | 118 | |
| Subtotal | 792 | 837 | 676 | 748 | 572 | |
| Total | Low-pollution vehicles | 2,141 | 2,270 | 2,088 | 2,480 | 2,212 |
| Other | 106 | 117 | 211 | 192 | 166 | |
| Subtotal | 2,247 | 2,387 | 2,299 | 2,672 | 2,378 | |
| Proportion of low-pollution vehicles (%) | Used on public roads | 97 | 97 | 96 | 97 | 97 |
| Used within plant grounds | 92 | 91 | 78 | 82 | 79 | |
| Total | 95 | 95 | 91 | 93 | 93 | |
- *Low-pollution vehiclesHybrid-electric vehicles, low-emission vehicles, fuel-efficient vehicles, and all-electric vehicles
Pollution Prevention and Resource Circulation / Water Resource Preservation
Asahi Kasei Group disposal of industrial waste
(Volume: thousands of tons, Percentage: %)
| Fiscal year | Category | Waste generated | Material recycling |
Chemical recycling |
Heat recovery | Volume reduction | Final disposal | Coverage |
| 2024 | Japan (of which waste plastic)2 | 525.8 (19.4) |
381.1 (7.5) |
16.2 (1.3) |
112.8 (10.4) |
3.7 (0.1) |
12.0 (0.2) |
- |
|---|---|---|---|---|---|---|---|---|
| Overseas | 33.3 | 7.6 | 0.4 | 2.5 | 19.6 | 3.2 | - | |
| Total | 559.1 | 388.7 | 16.6 | 115.3 | 23.3 | 15.2 | - | |
| Percentage (%) | 100.0 | 69.5 | 3.0 | 20.6 | 4.2 | 2.7 | 58 | |
| 2023 | Japan (of which waste plastic)2 | 476.7 (20.4) |
358.1 (8.7) |
5.1 (0.8) |
99.4 (10.6) |
2.7 (0.1) |
11.3 (0.2) |
- |
| Overseas | 37.3 | 7.6 | 0.7 | 2.6 | 4.0 | 22.5 | - | |
| Total | 514.0 | 365.7 | 5.8 | 102.0 | 6.7 | 33.9 | - | |
| Percentage (%) | 100.0 | 71.2 | 1.1 | 19.8 | 1.3 | 6.6 | 60 | |
| 20221 | Japan (of which waste plastic)2 | 555.7 (21.3) |
430.0 (9.2) |
4.9 (0.9) |
104.9 (10.8) |
3.2 (0.1) |
12.6 (0.3) |
- |
| Overseas | 45.2 | 16.0 | 0.8 | 3.5 | 2.9 | 22.0 | - | |
| Total | 600.9 | 446.0 | 5.7 | 108.4 | 6.1 | 34.7 | - | |
| Percentage (%) | 100.0 | 74.2 | 1.0 | 18.0 | 1.0 | 5.8 | 61 | |
| 2021 | Japan3 | 530.4 | 385.3 | 8.7 | 124.5 | 2.6 | 9.5 | - |
| Overseas | 47.1 | 15.6 | 0.4 | 2.0 | 4.8 | 24.4 | - | |
| Total | 577.5 | 400.8 | 9.0 | 126.4 | 7.3 | 33.9 | - | |
| Percentage (%) | 100.0 | 69.4 | 1.6 | 21.9 | 1.3 | 5.9 | 62 | |
| 2020 | Japan3 | 541.9 | 398.3 | 8.5 | 122.2 | 2.4 | 10.5 | - |
| Overseas | 29.1 | 8.4 | 0.5 | 1.3 | 3.8 | 15.0 | - | |
| Total | 571.0 | 406.6 | 9.1 | 123.6 | 6.3 | 25.4 | - | |
| Percentage (%) | 100.0 | 71.2 | 1.6 | 21.6 | 1.1 | 4.5 | - |
- 1The definitions of "material recycling" and "heat recovery" were changed in FY2022
- 2Disposal of waste plastics based on the Plastic Resource Circulation Act (excluding valuable resources)
- 3Changed to include industrial waste from the domestic homes business in FY2022; figures for previous years have been revised accordingly
Emissions of specially controlled industrial waste*
(thousand tons)
| Fiscal year | 2020 | 2021 | 2022 | 2023 | 2024 | Specially controlled industrial waste | 34.7 | 23.1 | 18.6 | 14.6 | 19.9 |
|---|
- *Specially controlled industrial waste is industrial waste that is explosive, toxic, infectious, or has other characteristics that may be hazardous to human health or the living environment
Recycled volume of Hebel™ from Asahi Kasei Construction Materials
(tons)
| FY2020 | FY2021 | FY2022 | FY2023 | FY2024 | |
| Hebel™ panels | 350 | 217 | 325 | 306 | 325 |
|---|---|---|---|---|---|
| Cement materials | 259 | 194 | 202 | 112 | 192 |
| Lightweight artificial soil | 0 | 0 | 0 | 0 | 0 |
| Total | 609 | 411 | 527 | 418 | 516 |
Maintenance and management status of waste treatment facilities*
| Facility | FY2023 | FY2024 | FY2025 | FY2026 |
|---|---|---|---|---|
| Kawasaki Works Incineration Plant (W-1000) | 2023 Results | 2024 Results | 2025 Results | 2026 Results |
| Kawasaki Works Incineration Plant (N-1000) | 2023 Results | 2024 Results | 2025 Results | 2026 Results |
- * Based on the Act on Waste Management and Public Cleansing, we have posted maintenance and management records for waste treatment facilities owned by our company that are required to publish maintenance and management information.
Release and transfer of PRTR-specified substances
(tons)
| FY2000 | FY2020 | FY2021 | FY2022 | FY2023* | FY2024 | |
| Release to air | 4,720 | 250 | 230 | 400 | 530 | 410 |
|---|---|---|---|---|---|---|
| Release to water | 170 | 50 | 60 | 40 | 70 | 40 |
| Release to soil | 0 | 0 | 0 | 0 | 0 | 0 |
| Total release | 4,890 | 300 | 290 | 440 | 600 | 450 |
| Reduction rate (%) | - | 94 | 94 | 91 | 88 | 91 |
| Transfer | 2,100 | 2,700 | 2,500 | 2,600 | 3,000 | 3,300 |
- *PRTR-specified substances changed in fiscal 2023 due to regulatory revision.
VOC* air emissions
| FY2000 (baseline year) |
FY2020 | FY2021 | FY2022 | FY2023 | FY2024 | |
| Emissions (tons) | 10,400 | 920 | 1,000 | 1,200 | 1,000 | 870 |
| Reduction rate (%) | - | 91 | 90 | 89 | 90 | 92 |
- *VOC Volatile organic compound. Although the term generally applies to any organic compound which is in gaseous state at the time of release, regulations for the control of their release exclude methane and some fluorocarbons which do not form oxidants.
FY2024 release and transfer of PRTR-specified substances
(tons)
| Company | Sites | Substance | Release to air | Release to water | Release to soil | Releases of VOCs Total |
Transfer |
| Asahi Kasei Corp. | Nobeoka | 1,1-Dichloroethylene (vinylidene chloride) | 25 | 0 | 0 | 25 | 263 |
|---|---|---|---|---|---|---|---|
| Dichloromethane (methylene chloride) | 9 | 0 | 0 | 9 | 0 | ||
| Chloroethylene (vinyl chloride) | 6 | 0 | 0 | 7 | 0 | ||
| Water-soluble copper salts (except complex salts) | 0 | 17 | 0 | 17 | 0 | ||
| 1,2-Dichloroethylene | 6 | 0 | 0 | 6 | 61 | ||
| Tetrafluoroethylene | 36 | 0 | 0 | 36 | 0 | ||
| Moriyama | Dichloromethane (methylene chloride) | 12 | 0 | 0 | 12 | 0 | |
| N,N-dimethylacetamide | 6 | 0 | 0 | 6 | 196 | ||
| Mizushima | n-Hexane | 106 | 0 | 0 | 106 | 23 | |
| Vinyl acetate | 8 | 0 | 0 | 8 | 4 | ||
| Kawasaki | n-Hexane | 42 | 0 | 0 | 42 | 6 | |
| Cyclohexane1 | 72 | 0 | 0 | 72 | 70 | ||
| Asahi Kasei Medical | Nobeoka | N,N-dimethylacetamide | 2 | 5 | 0 | 7 | 136 |
| Japan Elastomer | Oita | Cyclohexane | 29 | 0 | 0 | 29 | 4 |
- Notes:
- ・Substances whose total emissions into the air, water, and soil at a given site are at least five tons/year are listed along with their emission amounts, etc.
- 1Combined total for two workplaces emitting 5 tons or more per year of the substances subject to reporting
Asahi Kasei Group (Japan) fluorocarbon leakage volume
(tons CO2)
| Core Operating Companies / Affiliated Companies | FY2021 | FY2022 | FY2023 | FY2024 |
| Asahi Kasei Corp. | 1,265.3 | 949.9 | 499.4 | 972.3 |
|---|---|---|---|---|
| Asahi Kasei Medical Co., Ltd. | 244.4 | 116.7 | 31.0 | 0 |
| Asahi Kasei Pharma Corp. | 58 | 99.3 | 33.9 | 0 |
| Asahi Kasei Homes Corp. | 3.3 | 40.6 | 1.6 | 0.5 |
| Asahi Kasei Construction Materials Corp. | 1.2 | 14.2 | 0 | 32.7 |
| Asahi Kasei Microdevices Corp. | 0 | 0 | 0 | 12.3 |
| Other affiliated companies | 152.4 | 106.1 | 50.1 | 584.9 |
| Total | 1,724.5 | 1,326.9 | 616.0 | 1,602.7 |
Release of air and water pollutants
| Item | Unit | FY2020 | FY2021 | FY2022 | FY2023 | FY2024 |
| SOx1 | Tons | 5,200 | 6,800 | 3,700 | 2,000 | 2,000 |
|---|---|---|---|---|---|---|
| NOx2 | Tons | 3,600 | 3,500 | 2,600 | 1,700 | 1,900 |
| Soot and dust3 | Tons | 110 | 140 | 90 | 70 | 70 |
| Water discharges | Million m3 | 204 | 202 | 200 | 194 | 195 |
| COD4 | Tons | 850 | 850 | 760 | 730 | 720 |
| N | Tons | 4,900 | 5,900 | 4,500 | 5,700 | 5,500 |
| P | Tons | 20 | 20 | 20 | 20 | 20 |
| Coverage | % | - | 76 | 75 | 77 | 74 |
- Notes:
- 1 Sulfur oxides (SOx) are formed when crude oil, fuel oil, or coal containing sulfur are used as fuel. Sulfur dioxide (SO2) is most common, but some sulfur trioxide (SO3) also forms. The term SOx is inclusive of both of these.
- 2 Nitrogen oxides (NOx) are formed during combustion at thermal power plants, factory boilers, internal combustion engines, and incinerators. The term NOx is inclusive of both nitric oxide (NO) and nitrogen dioxide (NO2).
- 3 Soot and dust are fine particles formed in the combustion of fuel and other materials.
- 4 Chemical oxygen demand is an indicator of water pollution by organic substances. COD is expressed in terms of the amount of oxygen that can be consumed by an oxidizer to chemically oxidize the organic substances contained in the water.
Air emissions by site
(tons)
| FY2022 | FY2023 | FY2024 | |||||||
| Site | SOx | NOx | Soot and dust | SOx | NOx | Soot and dust | SOx | NOx | Soot and dust |
| Nobeoka | 3,400 | 1,400 | 30 | 1,800 | 670 | 20 | 1,800 | 660 | 10 |
|---|---|---|---|---|---|---|---|---|---|
| Mizushima | 210 | 1,000 | 50 | 210 | 760 | 40 | 230 | 970 | 40 |
| Moriyama | 0 | 90 | 3 | 0 | 96 | 2 | 0 | 100 | 3 |
| Fuji | 0 | 3 | 0 | 0 | 3 | 0 | 0 | 3 | 0 |
| Ohito | 4 | 5 | 0 | 3 | 6 | 0 | 3 | 6 | 0 |
| Kawasaki | 2 | 100 | 5 | 3 | 110 | 8 | 3 | 100 | 8 |
| Suzuka | 0 | 20 | 0 | 0 | 22 | 0 | 0 | 20 | 0 |
| Other | 90 | 30 | 3 | 4 | 77 | 1 | 0 | 70 | 1 |
| Total | 3,700 | 2,600 | 90 | 2,000 | 1,700 | 70 | 2,000 | 1,900 | 70 |
Water withdrawals and discharges
(Million m3)
| Item | FY2020 | FY2021 | FY2022 | FY2023 | FY2024 | |
| Japan | Withdrawals | 235 | 245 | 236 | 234 | 245 |
|---|---|---|---|---|---|---|
| Discharges | 204 | 202 | 200 | 194 | 195 | |
| Overseas | Withdrawals | 9 | 9 | 9 | 8 | 9 |
| Discharges | 4 | 4 | 4 | 4 | 4 | |
| Total | Withdrawals | 244 | 254 | 245 | 242 | 254 |
| Discharges | 208 | 206 | 204 | 198 | 199 | |
Water withdrawals and sources in Japan
(Million m3)
| FY2020 | FY2021 | FY2022 | FY2023 | FY2024 | |
| Water withdrawals | 235 | 245 | 236 | 234 | 245 |
|---|---|---|---|---|---|
| Municipal water | 2 | 2 | 2 | 2 | 2 |
| Ground water | 20 | 20 | 18 | 25 | 26 |
| Industrial water | 213 | 223 | 216 | 207 | 217 |
Water discharges by site
(tons)
| Site | FY2022 | FY2023 | FY2024 | |||||||||
| COD | N | P | Water discharges (106 m3) |
COD | N | P | Water discharges (106 m3) |
COD | N | P | Water discharges (106 m3) |
|
| Nobeoka | 600 | 4,200 | 4 | 125 | 580 | 5,400 | 3 | 125 | 570 | 5,300 | 4 | 131 |
|---|---|---|---|---|---|---|---|---|---|---|---|---|
| Mizushima | 50 | 160 | 3 | 32 | 40 | 150 | 3 | 29 | 40 | 120 | 3 | 27 |
| Moriyama | 6 | 8 | 1 | 9 | 5 | 7 | 1 | 9 | 5 | 6 | 2 | 8 |
| Fuji | 20 | 90 | 8 | 14 | 10 | 80 | 10 | 12 | 10 | 70 | 9 | 12 |
| Ohito | 0 | 1 | 0 | 0 | 0 | 1 | 0 | 0 | 0 | 1 | 0 | 0 |
| Kawasaki | 60 | 30 | 1 | 13 | 60 | 30 | 1 | 13 | 60 | 30 | 1 | 10 |
| Suzuka | 6 | 2 | 0 | 2 | 5 | 2 | 0 | 2 | 6 | 2 | 0 | 2 |
| Other | 20 | 3 | 0 | 5 | 20 | 2 | 0 | 4 | 20 | 2 | 0 | 4 |
| Total | 760 | 4,500 | 20 | 200 | 730 | 5,700 | 20 | 194 | 720 | 5,500 | 20 | 195 |
Number of Group Employees
| Scope | FY2020 | FY2021 | FY2022 | FY2023 | FY2024 | ||
| Number of Group Employees | Total | Asahi Kasei Group consolidated (global) |
44,497 | 46,751 | 48,897 | 49,295 | 50,352 |
|---|---|---|---|---|---|---|---|
| Male | ― | 33,265 | 34,630 | 34,741 | 35,254 | ||
| Female | ― | 13,443 | 14,254 | 14,537 | 15,086 | ||
| Gender unspecified | ― | 43 | 13 | 17 | 12 | ||
| Female employee rate (%) | ― | 28.8 | 29.1 | 29.5 | 30.0 | ||
- Note:Gender according to individuals' self-identification.
Number of Employees by Employment Status
| Scope | FY2020 | FY2021 | FY2022 | FY2023 | FY2024 | ||
| Permanent | Total | Note 1 | 17,417 | 17,413 | 17,267 | 17,460 | 17,716 |
|---|---|---|---|---|---|---|---|
| Male | 14,593 | 14,555 | 14,352 | 14,492 | 14,668 | ||
| Female | 2,824 | 2,858 | 2,915 | 2,968 | 3,048 | ||
| Non-permanent | Total | Note 1 | 3,360 | 2,875 | 3,133 | 2,889 | 2,427 |
| Male | 2,382 | 1,966 | 2,232 | 2,031 | 1,607 | ||
| Female | 978 | 909 | 901 | 858 | 820 | ||
| Non-permanent rate (%) | 16.2 | 14.2 | 15.4 | 14.2 | 12.0 | ||
- Note:Due to a review of the aggregation method, the figures for the “non-permanent rate” from FY2020 to FY2023 have been revised.
Employment of Persons with Disabilities
| Scope | FY2020 | FY2021 | FY2022 | FY2023 | FY2024 | |
| Number of employees with disabilities | All Group companies applicable as Special Subsidiaries [Scope Note 2] | 623 | 643 | 657 | 715 | 720 |
|---|---|---|---|---|---|---|
| Employment rate (%) | 2.38 | 2.42 | 2.4 | 2.58 | 2.61 | |
| Statutory employment rate (%) | 2.3 | 2.3 | 2.3 | 2.3 | 2.5 |
Employment/Turnover
| Scope | FY2020 | FY2021 | FY2022 | FY2023 | FY2024 | ||
| Number of new hires | New graduate total | Note 1 | 586 | 460 | 425 | 436 | 515 |
|---|---|---|---|---|---|---|---|
| Male | 466 | 369 | 340 | 337 | 394 | ||
| Female | 120 | 91 | 85 | 99 | 121 | ||
| Mid-career total | 298 | 345 | 378 | 362 | 286 | ||
| Male | 276 | 297 | 303 | 299 | 230 | ||
| Female | 22 | 48 | 75 | 63 | 56 | ||
| Mid-career hire rate (%) | 33.7 | 42.9 | 47.1 | 45.4 | 35.3 | ||
| Number of employee turnover | 283 | 328 | 364 | 523 | 564 | ||
| Employee turnover rate (%) | 1.58 | 1.83 | 2.04 | 2.95 | 3.12 | ||
Working Hours / Salary
| Scope | FY2020 | FY2021 | FY2022 | FY2023 | FY2024 | |
| Total hours worked | Note 1 | 1,974 | 1,992 | 1,966 | 1,954 | 1,941 |
|---|---|---|---|---|---|---|
| Overtime hours worked | 261 | 287 | 270 | 269 | 263 | |
| Average paid vacation days taken | 14.3 | 14.8 | 16.3 | 16.1 | 16 | |
| Average rate of paid vacation (%) | 75.3 | 77.6 | 85.4 | 84.4 | 84.2 | |
| Average annual salary (¥) | Asahi Kasei Corp. | 7,691,021 | 7,810,513 | 7,605,539 | 7,528,168 | 8,000,906 |
- Note:Average figures per employee shown.
Education/Training
| Scope | FY2020 | FY2021 | FY2022 | FY2023 | FY2024 | |
| Total training hours | Note 1 | 374,068 | 388,701 | 446,280 | 494,197 | 487,031 |
|---|---|---|---|---|---|---|
| Average time per employee | 21.5 | 22.3 | 25.7 | 28.1 | 27.0 | |
| Total cost of training conducted in Japan (thousand yen) | 2,129,282 | 2,806,147 | 3,471,596 | 4,248,249 | 4,670,421 | |
| Annual training costs in Japan (thousand yen) | 126 | 166 | 198 | 242 | 259 |
Diversity / Work-life Balance
| Scope | FY2020 | FY2021 | FY2022 | FY2023 | FY2024 | ||
| Number of female managers* | Note 1 | 229 | 252 | 278 | 313 | 335 | |
|---|---|---|---|---|---|---|---|
| Total number of managers* | 5,526 | 5,613 | 5,495 | 5,541 | 5,663 | ||
| Ratio of female managers (%)* | 4.1 | 4.5 | 5.1 | 5.6 | 5.9 | ||
| Proportion of women working as managers and Group Masters (%)* | 3.2 | 3.6 | 4.0 | 4.3 | 4.9 | ||
| Number of employees taking child care leave | Male | 433 | 496 | 538 | 589 | 593 | |
| Female | 265 | 287 | 306 | 285 | 291 | ||
| Number of employees using shortened working hours system for child care | Male | 4 | 2 | 1 | 5 | 11 | |
| Female | 366 | 322 | 307 | 304 | 327 | ||
| Number of employees using "Kids Support" shortened working hours system | Male | 0 | 0 | 0 | 0 | 1 | |
| Female | 123 | 135 | 154 | 163 | 157 | ||
| Number of employees taking family care leave | Male | 6 | 2 | 3 | 2 | 5 | |
| Female | 4 | 2 | 5 | 6 | 5 | ||
| Number of employees using shortened working hours system for family care | Male | 4 | 2 | 1 | 0 | 0 | |
| Female | 2 | 0 | 2 | 5 | 5 | ||
- *As of April 1 of the following fiscal year
Gender Pay Gap
| Scope | FY2022 | FY2023 | FY2024 | |||
|---|---|---|---|---|---|---|
| Average annual salary (¥) | Female | All workers | Note 1 | 5,860,247 | 5,976,307 | 6,385,487 |
| Permanent employees | 6,520,585 | 6,604,634 | 6,939,275 | |||
| Part-time / Fixed-term employees | 3,459,754 | 3,553,597 | 3,708,737 | |||
| Male | All workers | 8,604,480 | 8,503,638 | 8,931,131 | ||
| Permanent employees | 8,767,621 | 8,662,984 | 9,099,823 | |||
| Part-time / Fixed-term employees | 5,157,015 | 5,315,244 | 5,581,443 | |||
| Difference in salary between men and women (%) | All workers | 68 | 70 | 72 | ||
| Permanent employees | 74 | 76 | 76 | |||
| Part-time / Fixed-term employees | 67 | 67 | 66 | |||
Occupational Health and Safety
| Scope | FY2020 | FY2021 | FY2022 | FY2023 | FY2024 | ||
| Group lost time frequency rate (%) | Note 3 | 0.21 | 0.38 | 0.20 | 0.34 | 0.31 | |
|---|---|---|---|---|---|---|---|
| Group severity rate (%) | 0.006 | 0.133 | 0.016 | 0.003 | 0.004 | ||
| Number of lost-time injuries | Group employees | 11 | 20 | 11 | 19 | 16 | |
| Contract employees | 1 | 2 | 1 | 1 | 3 | ||
| Total | 12 | 22 | 12 | 20 | 19 | ||
| Of which, number of fatal accidents | Group employees | 0 | 1 | 0 | 0 | 0 | |
| Contract employees | 0 | 0 | 0 | 0 | 0 | ||
| Total | 0 | 1 | 0 | 0 | 0 | ||
| Average age | Note 4 | 43.7 | 43.7 | 43.7 | 43.9 | 44.0 | |
| Rate of finding problems during health checkups (%) | 62.7 | 62.5 | 62.1 | 61.2 | 60.8 | ||
| BMI | 26.7 | 26.7 | 26.7 | 26.3 | 26.9 | ||
| Smoking rate (%) | 24.7 | 23.5 | 22.5 | 21.8 | 20.2 | ||
| Number of days absent due to injury or illness (days per person; calculated based on reports of absence from work) | 3.1 | 3.4 | 3.9 | 3.9 | 4.1 | ||
| Specific health guidance rate (%) | 35.2 | 46.7 | 58.3 | 64.6 | |||
| Stress check rate (%) | 96.3 | 93.8 | 92.0 | 94.3 | 95.9 | ||
| High stress rate (%) | 8.0 | 8.6 | 8.9 | 8.4 | 8.0 | ||
Presenteeism (%)
|
ー | ー | ー | ー | 84.1 | ||
Work engagement
|
― | 3.54 | 3.54 | 3.55 | 3.57 | ||
Rate of favorable responses for work engagement (%)
|
54.7 | 55.3 | 55.6 | 56.2 | 57.3 | ||
Workplace dialogue implementation rate (%)*
|
41.0 | 55.0 | 70.0 | 73.8 | 72.3 | ||
Health literacy
|
ー | ー | ー | ー | 3.61 | ||
| Self-care education participation rate (%) | ― | ― | 98.0 | 95.4 | 96.2 | ||
| Rate of employees who reviewed their behavior and lifestyles after attending health-related training (%) | ― | ― | 90.4 | 91.9 | 95.6 | ||
- Note:Due to a review of the aggregation method, the figures for the “workplace dialogue implementation rate” from FY2021 to FY2023 have been revised.
Social Contributions
| Scope | FY2020 | FY2021 | FY2022 | FY2023 | FY2024 | |
| Social contribution activity expenses (¥ million) | Asahi Kasei Group consolidated (global) |
2,147 | 1,799 | 1,574 | 1,650 | 1,370 |
|---|---|---|---|---|---|---|
| Proportion of ordinary income (%) | 1.21 | 0.85 | 1.29 | 1.83 | 0.71 |
- Note:Due to an error in the calculation method, the FY2020 figure for the “proportion of ordinary income” has been revised.
Scope Notes
- 1Asahi Kasei, Asahi Kasei Microdevices, Asahi Kasei Homes, Asahi Kasei Construction Materials, Asahi Kasei Pharma, and Asahi Kasei Medical (Asahi Kasei Life Science from April 2025 onwards)
- 2The rate of employment and the number of persons employed are the average figures for each fiscal year for applicable companies of the Asahi Kasei Group. Calculations are based on total employment of 27,921 persons at the 22 applicable companies as of March 31, 2025. (number of persons calculated in accordance with the Act on Employment Promotion, etc. of Persons with Disabilities)
- 3Asahi Kasei Group companies in Japan as defined in the Asahi Kasei Group ESH & QA Regulations (a list of departments implementing Asahi Kasei's ESH & QA Program can be downloaded from the following page)
https://www.asahi-kasei.com/sustainability/rc/#anc-09 - 4Employees of major Japanese subsidiaries in addition to companies listed in Note 1
Corporate Governance
| Scope | FY2020 | FY2021 | FY2022 | FY2023 | FY2024 | FY2025 | |||
| Number of Directors | Inside Directors | Male | Asahi Kasei Corp. | 6 | 6 | 6 | 6 | 6 | 5 |
|---|---|---|---|---|---|---|---|---|---|
| Female | 0 | 0 | 0 | 0 | 0 | 0 | |||
| Total | 6 | 6 | 6 | 6 | 6 | 5 | |||
| Independent Outside Directors | Male | 2 | 2 | 2 | 2 | 2 | 2 | ||
| Female | 1 | 1 | 1 | 2 | 2 | 2 | |||
| Total | 3 | 3 | 3 | 4 | 4 | 4 | |||
| Total | 9 | 9 | 9 | 10 | 10 | 9 | |||
| Proportion of Female Members of the Board of Directors (%) | 11.1 | 11.1 | 11.1 | 20.0 | 20.0 | 22.2 | |||
- (As of July of each year)
- Note:The number of Board of Directors meetings and committee meetings and their attendance rates are reported on the following page.